


Data Analysis and Visualization
Accelerate your Career
Learn data analysis and visualization with Python. Explore data cleaning, statistical analysis, and interactive visualizations using Pandas, Matplotlib, and Seaborn.
Buy this Course @
₹1,499
Data Analysis and Visualization Course
Overview
This Explorer-level course focuses on transforming data into meaningful insights through visualization, statistical analysis, and reporting techniques. Learners will explore data visualization libraries such as Matplotlib and Seaborn to create professional charts, plots, and analytical dashboards. The curriculum also covers data wrangling, data processing, Google Colab workflows, and handling real-world datasets for analytical applications. Participants will build a strong understanding of statistical concepts including distributions, correlation analysis, hypothesis testing, and descriptive statistics. The course further introduces business intelligence reporting through Tableau and Power BI, enabling learners to create interactive dashboards and business reports. By the end of the course, participants will be equipped to analyze, visualize, and communicate data effectively across business and technical environments.
Course Stats
₹12.35 LPA
Average Salary₹42 LPA
Highest Salary135%
Salary Hike7+ Companies
Hiring PartnersCapstone Project
Real challenges. Real solutions. Your portfolio will feature these production-grade applications.


Industry Standard Tools & Technologies
Master the primary simulation and hardware tools used by electrical engineers globally.
...
Key Features
Mentorship
Receive guidance and insights from industry expertsHands-on Experience
Gain practical skills in a real-world cutting-edge projects.Networking
Connect with professionals and peers in your fieldSkill Development
Enhance your technical and soft skillsCareer Advancement
Boost your resume with valuable experienceDual Certificate
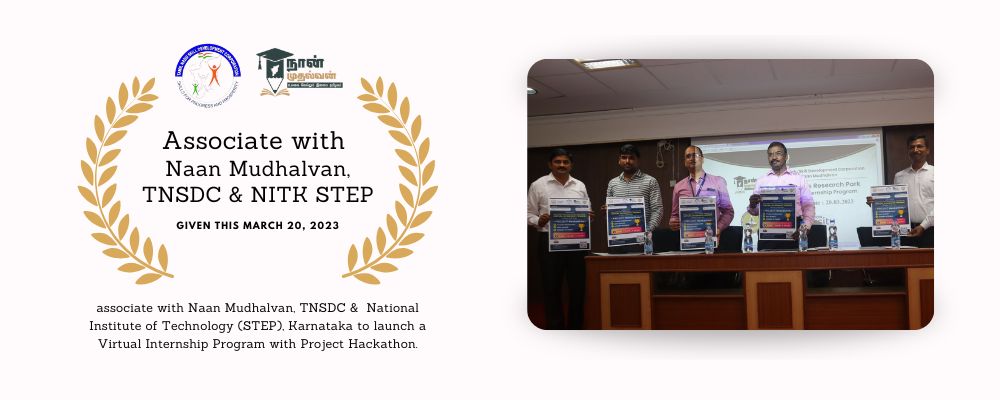
Get a certification to showcase your achievementsWe are Accredited by


Our Awards & Achievements