Home > Courses > Data Science & Analytics

Data Analytics and Visualization using Power BI

Accelerate your Career

Learn Data Analytics and Visualization using Power BI. Master data modeling, DAX, dashboards, reports, and business intelligence solutions.

5 Modules
with Certifications
10:31 Hours
of Recorded Content
4.5 Ratings
by 1299 Learners
English
Language
Paid Course
Get this Course @ ₹1,499
1299 enrolled in this course

Data Analytics and Visualization using Power BI

Data-driven decision making is at the core of modern businesses, making Business Intelligence professionals highly valuable across industries. This course equips learners with practical expertise in Power BI, data visualization, data transformation, and dashboard development through hands-on projects and real-world datasets. Beginning with Power BI fundamentals and supporting Python-based visualization concepts, learners progress to building interactive dashboards using Netflix, IMDb, and IPL datasets while mastering Power Query, data modeling, conditional formatting, and analytical reporting techniques. The program culminates in a comprehensive capstone project that enables participants to showcase production-ready business intelligence solutions and develop industry-relevant analytical skills.
MASTERING THE DATA SCIENCE LIFECYCLE

Comprehensive Syllabus Outline

A comprehensive curriculum designed to take you from beginner to professional.

M1

Module 1 - Power BI Foundations and Data Preparation

Getting Started with Power BI Installation and Workspace Setup
Understanding Python Data Structures for Analytics Integration
Creating Analytical Visualizations using Matplotlib
Advanced Statistical Visualization using Seaborn
Data Transformation and Preparation using Power Query

M2

Module 2 - Netflix Analytics Dashboard Project

Analyzing Netflix Content Data using Power BI Visualizations
Creating Custom Measures and KPIs for Netflix Analytics
Using Conditional Formatting for Dashboard Storytelling
Applying Sorting and Filtering Techniques for Data Exploration
Transforming Netflix Data using Power Query Editor

M3

Module 3 - IMDB Analytics Dashboard Project

Building Interactive IMDB Analytics Dashboards
Data-Driven Decision Making using IMDB Analytics
Data Categorization using Bins and Groups in Power BI
Data Transformation and Analysis using Power Query Editor
Optimizing Reports through Column Selection and Data Modeling

M4

Module 4 - IPL Analytics Dashboard Project

Creating an IPL Performance Analytics Dashboard
Data Grouping and Categorization Techniques in Power BI
Visualizing High and Low Performance Metrics in IPL Data
Applying Power Query for Sports Analytics Reporting

M5

Module 5 - Capstone Project

Capstone Dashboard Development using Business Data
Presenting Business Insights through Interactive Dashboards

Capstone Project

Business Intelligence Dashboard Portfolio

Build end-to-end applications that demonstrate practical implementation of concepts covered throughout the course.

Interactive Netflix Content Analysis Dashboard
PROJECT

Interactive Netflix Content Analysis Dashboard

Access hands-on simulation modules to master production level engineering challenges.

IMDb Global Ratings & Revenue Performance Report
PROJECT

IMDb Global Ratings & Revenue Performance Report

Access hands-on simulation modules to master production level engineering challenges.

IPL Sports Analytics and Strategic Insight Tracker
PROJECT

IPL Sports Analytics and Strategic Insight Tracker

Access hands-on simulation modules to master production level engineering challenges.

Production-ready Portfolio showcasing end-to-end Data Prep and Visualization
PROJECT

Production-ready Portfolio showcasing end-to-end Data Prep and Visualization

Access hands-on simulation modules to master production level engineering challenges.

CORE TOOLING MASTERY

Tech Stack

Master the primary professional software development packages and workflow tools.

Microsoft Power BI
Power Query Editor
Python
Matplotlib
Seaborn
Data Modeling
Business Intelligence Reporting
Career Impact

After this Course, You will be Able to

Observe the real-world utility outcomes you gain after program completion.

Architect interactive business intelligence dashboards from scratch using Microsoft Power BI.
Execute complex data cleaning and ETL processes using the Power Query Editor.
Augment Power BI reports with custom Python scripts using Matplotlib and Seaborn for advanced analytics.
Apply data modeling and conditional formatting to highlight critical business KPIs.
Transform disparate datasets into cohesive, storytelling visual reports for executive stakeholders.
Develop a professional portfolio of real-world analytics projects using Netflix, IMDb, and sports data.

Course Stats

₹10.5 LPA

Average Salary

₹38 LPA

Highest Salary

120%

Salary Hike

9,500+

Job Vacancies

Key Features

Mentorship

Receive guidance and insights from industry experts

Hands-on Experience

Gain practical skills in a real-world cutting-edge projects.

Networking

Connect with professionals and peers in your field

Skill Development

Enhance your technical and soft skills

Career Advancement

Boost your resume with valuable experience

Dual Certificate

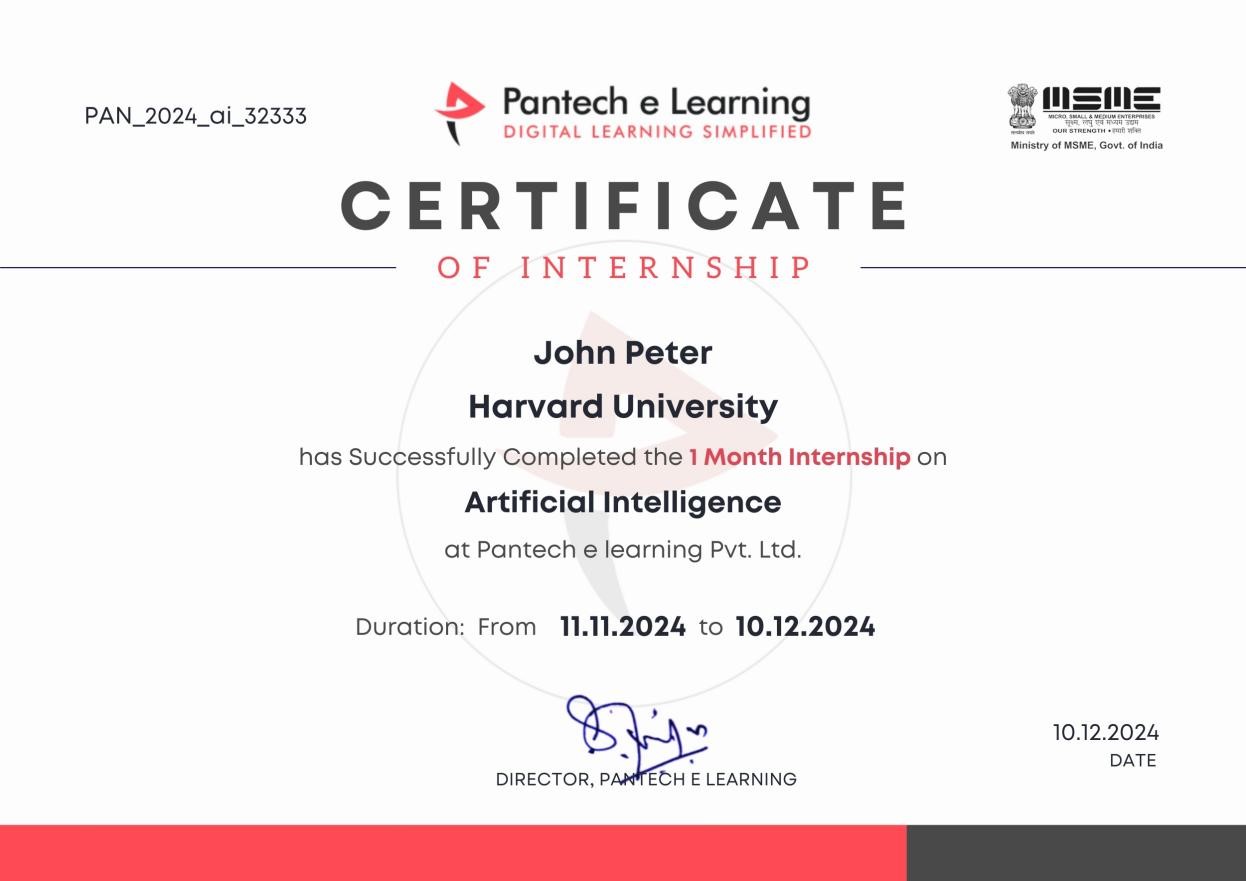
Get a certification to showcase your achievements
DIGITAL VERIFIABLE CREDENTIAL

Let Your Certificates Speak For You

Our certification formally validates your skill set in recruiter searches with unique QR code verification and LinkedIn-ready structures.

Unique Credential ID & QR Code
Recruiters can scan to instantly verify your project files, source repository, and official completion marks.

Linkedin Certified Recognition
Easily push to your Linkedin profile with 1-click credential linking to increase high-end corporate recruiter views.

Certificate Sample
Status
Verified

Where Our Learners Work

Our alumni are driving innovation at the world's most prestigious technology companies.

Flipkart
Freshworks
Juspay
Chargebee
Zoho
PayPal
PREMIER PLATFORM EXPERIENCE

Why Pantech?

An expert-crafted learning infrastructure built for technical fluency.

Industrial Expert Mentors

Direct guidance and weekly doubt clearing sessions hosted by hardware, embedded, and software engineering veterans.

24/7 Interactive Support

Ask coding doubts anytime on our student community workspace and receive instant assistance.

Self-Paced Learning Engine

Access lifetime recorded modules with adaptive pacing to balance academics and professional work.

Career Guidance Support

Exclusive resume review, mock interviews, and placement assistance from industry experts.

We are Accredited by

Our Awards & Achievements
Award 1
VERIFIED STUDENT REVIEWS

What Our Students Say

See how Pantech courses accelerated career transitions across India.

"test"
Student Pantech

Student Pantech

VERIFIED LEARNER
"Super"
Student Pantech

Student Pantech

VERIFIED LEARNER

Get exclusive lifetime access to coursework, simulators, custom templates, and direct placement opportunities.

Need immediate counseling?

+91 8925533488/89

HAVE QUESTIONS?

Frequently Asked Questions

Find instant answers to all common questions about our technical certificate courses.

1. Is this course suitable for beginners?

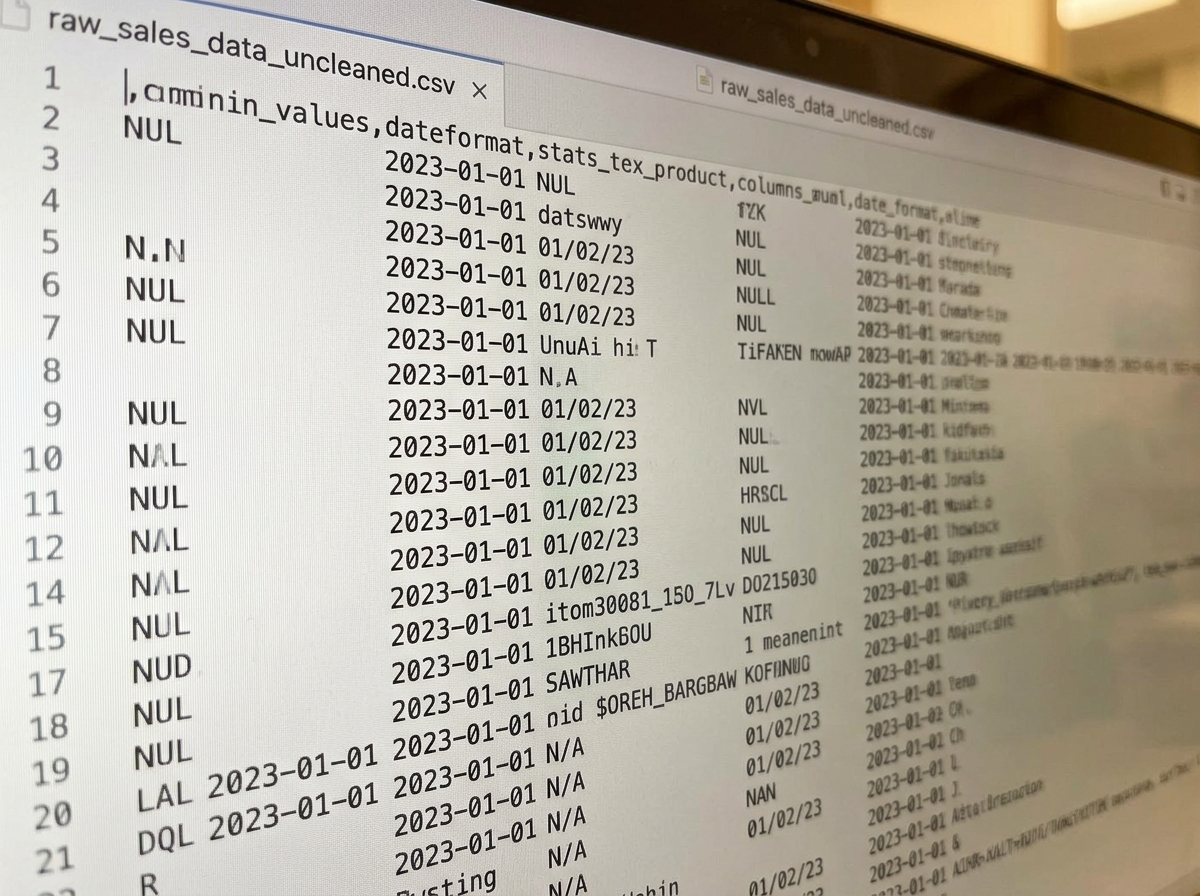
Yes. The course starts with Power BI installation, foundational concepts, and basic data visualization before progressing to advanced dashboard development and analytics projects.

2. What projects will I build?

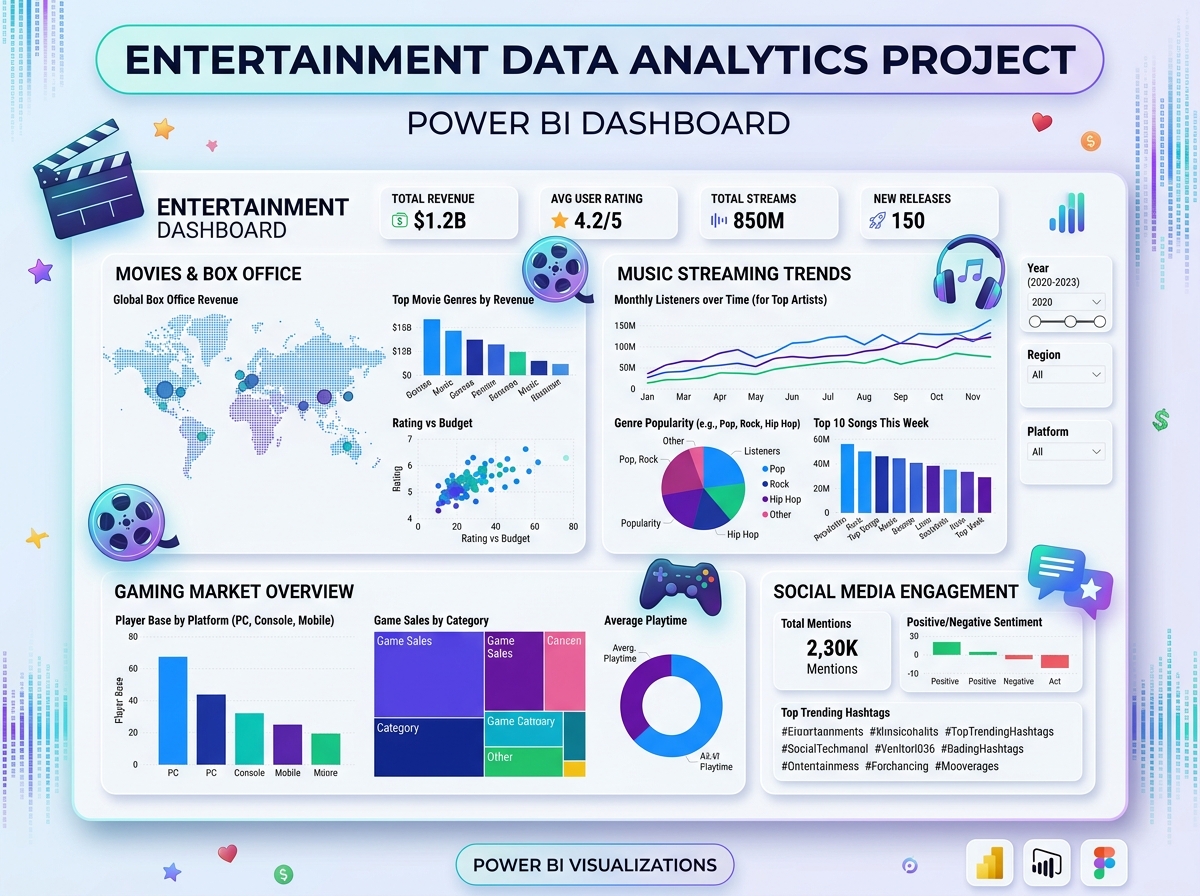
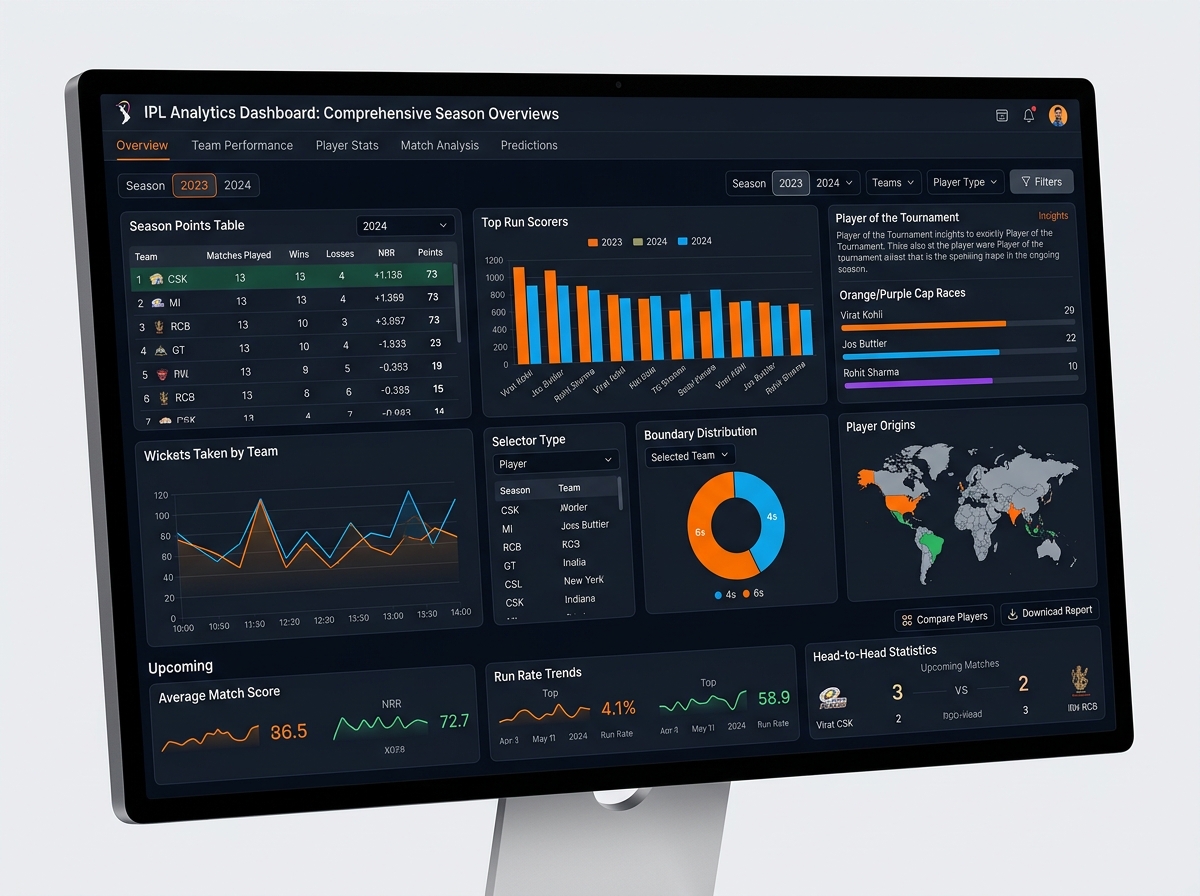
You will build practical projects including a Netflix Analytics Dashboard, IMDb Analytics Dashboard, IPL Analytics Dashboard, and a comprehensive Final Capstone Dashboard Project.

3. Which software tools will I use?

The course covers Microsoft Power BI, Power Query Editor, Python, Matplotlib, Seaborn, and Business Intelligence dashboarding techniques.

4. Are hands-on practical exercises included?

Yes. The curriculum includes guided dashboard development exercises, dataset analysis, Power Query implementation, visualization tasks, and project-based learning using real-world data.

5. What career opportunities does this course prepare me for?

This course prepares learners for roles such as Business Intelligence Analyst, Power BI Developer, Data Analyst, Reporting Analyst, Dashboard Developer, and Junior Business Intelligence Engineer.

Pantech AI Assistant
Hi Welcome to Pantech. How can I help you today?